Transform your data into actionable insights with powerful charts, real-time updates, and customizable dashboards that help you make better decisions.

Stat Cards turn your data into one clear metric

Distill your complex data into one simple, digestible metric that is easy to understand at a glance.
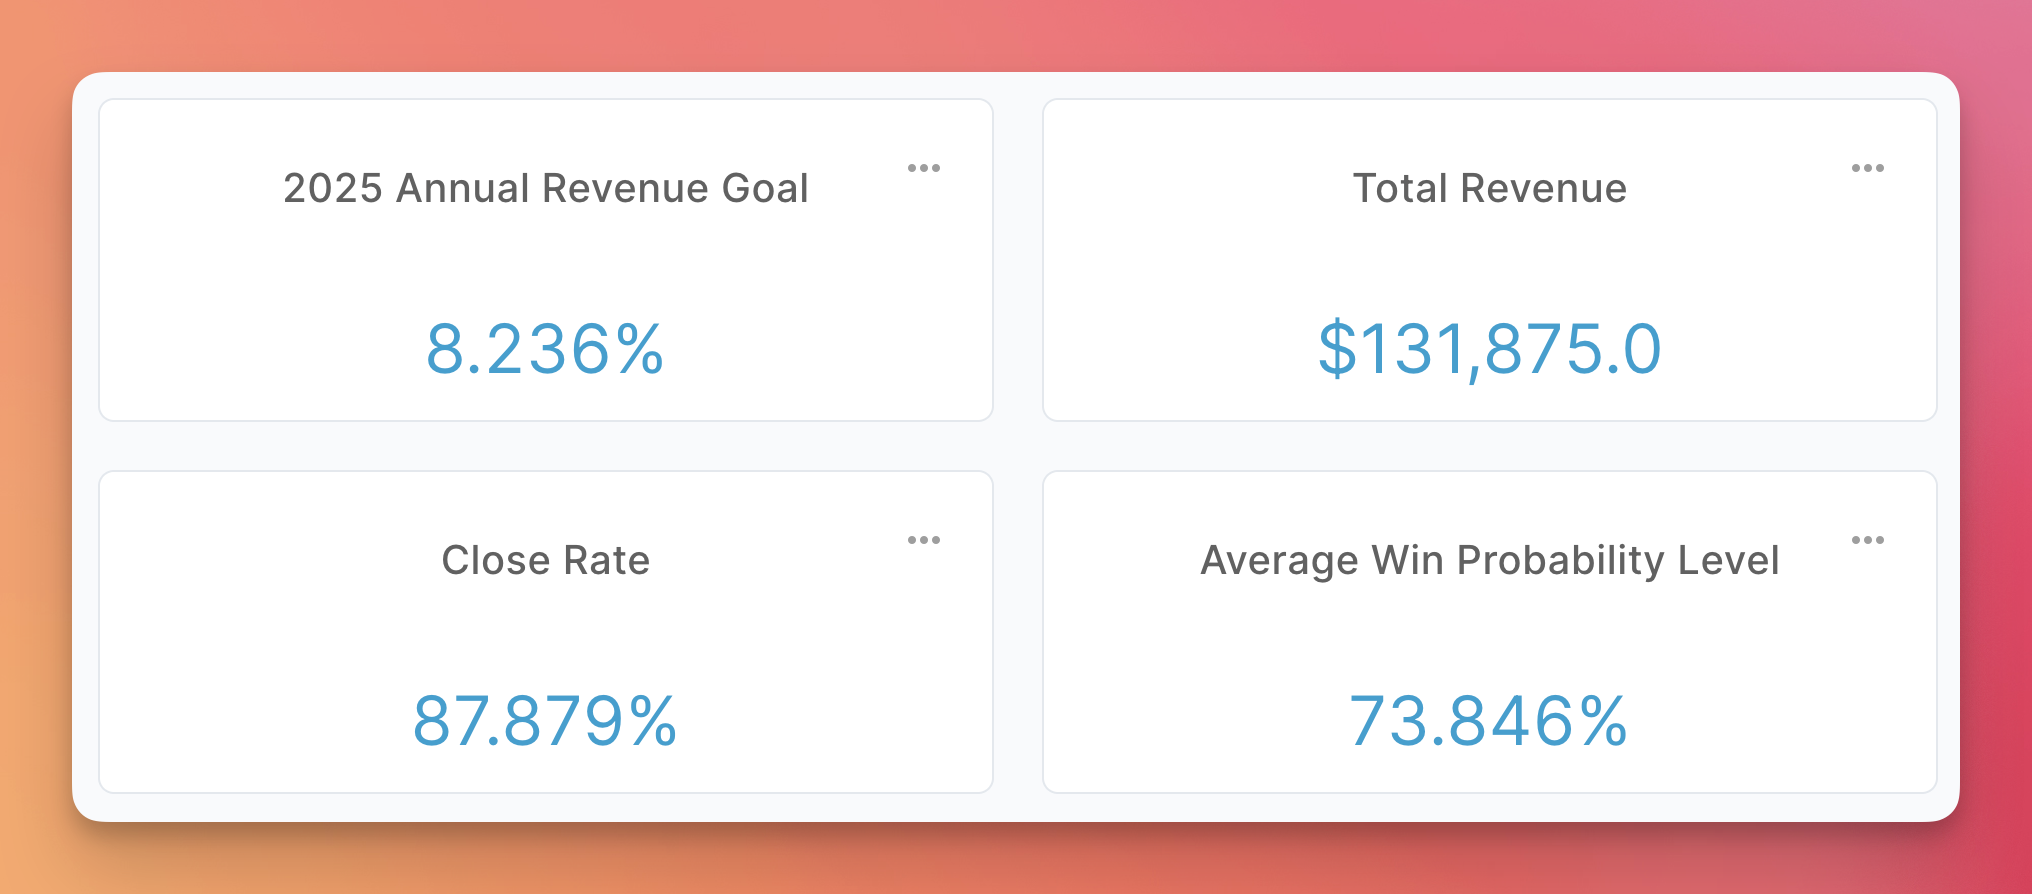
Instant Overview

View key metrics quickly. Data is summarized to sharpen focus and track progress.

Real-Time Updates

Monitor changes as they occur. Always be informed with the latest data.

Visually Engaging

Bold and clear design. Stat cards highlight critical numbers for quick assessment.

Pie Charts help you spot where to focus

Visualize data proportions instantly to prioritize efforts and resources efficiently.
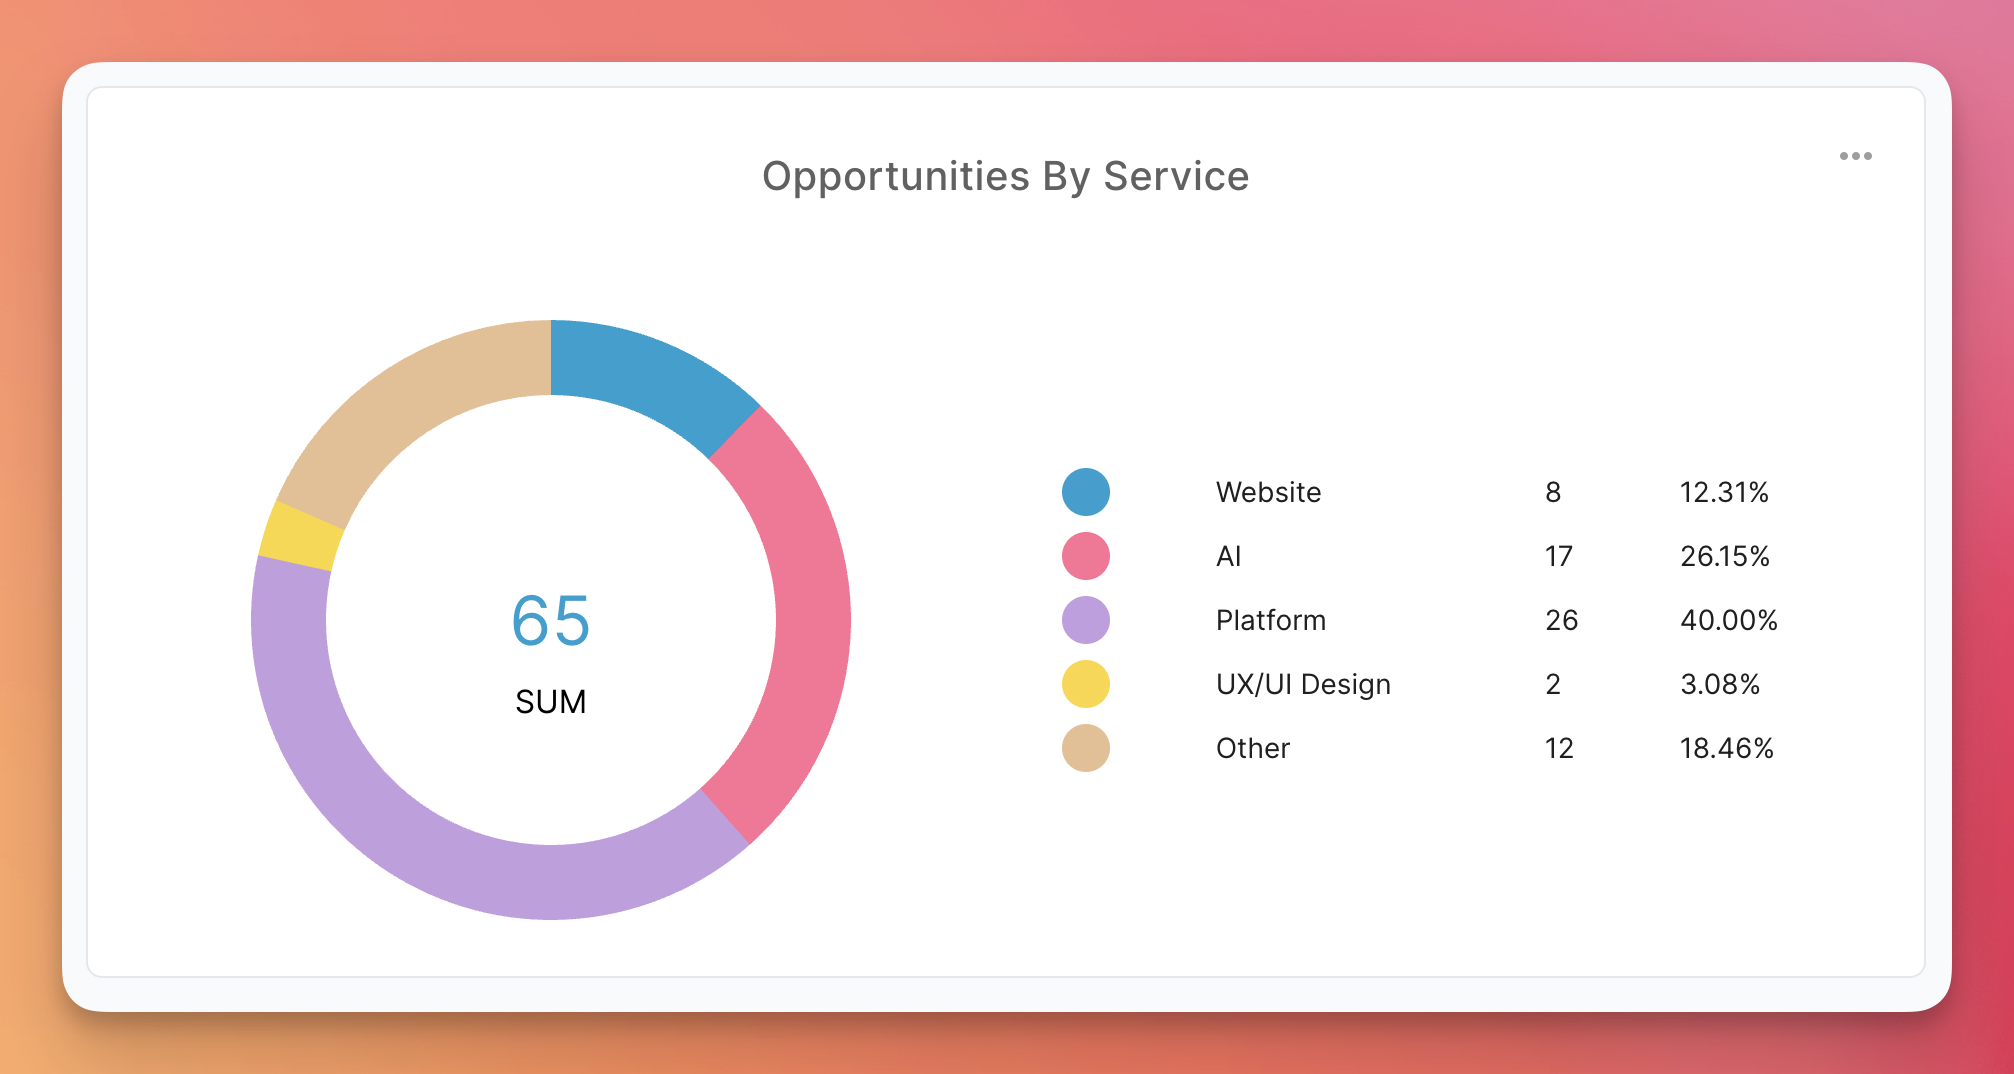
Visual Breakdown

View percentages and amounts together. Each slice shows size and value.

Flexible Totals

Customize how you total—average, count, max, min, or sum.

Color Insights

Color segments for quick trend spotting. Clear, distinct, informative.

Bar Charts allow you to spot trends over time

Track trends over time with precision. Blue's bar charts are updated automatically, giving you the insight to make data-driven decisions.

Trend Analysis

Track changes over time with clear visual progression. Spot patterns and trends instantly.

Easy Comparison

Compare multiple data sets side by side. Different time periods, teams, or categories at a glance.

Automatic Updates

Charts refresh with real-time data. Always see the most current trends and metrics.

Ready to get back to work? Turn your data into actionable insights.

Dashboard Features

Blue offers a comprehensive suite of visualization options including stat cards, pie charts, bar charts, line graphs, area charts, scatter plots, and more. Each chart type is designed to present your data in the most meaningful way possible.
Yes! Blue allows you to create cross-project dashboards that aggregate data from multiple sources. This gives you a complete view of your organization's performance in one centralized location.
Dashboards can be shared with specific team members or groups through Blue's permission system. You can control who can view, edit, or manage each dashboard, ensuring the right people have access to the right information.

Sharing & Customization

Yes, Blue allows you to create public dashboard links that can be shared with external stakeholders, clients, or partners. You can control which data is visible and set expiration dates for added security.
Blue provides powerful filtering capabilities including date ranges, custom fields, tags, status, assignees, and more. You can save filter presets and apply them across multiple charts for consistent data views.
Absolutely! Blue's dashboards feature a drag-and-drop interface that lets you arrange charts, resize widgets, and create the perfect layout for your needs. You can also save multiple layout configurations.

Support

We love hearing from our users! You can submit feedback through the in-app feedback button, join our community forum, or reach out to our support team directly. Your input helps us continuously improve Blue's dashboard capabilities.

AI Assistant

Responses are generated using AI and may contain mistakes.

How can I help you?

Ask me anything about Blue or this documentation.

Enter to send • Shift+Enter for new line • ⌘I to open